
Production debugging has a particular kind of frustration reserved for problems that don’t actually exist.
A function deployment fails. The dashboard turns red. Alerts fire across multiple channels. Engineers abandon their current work and start combing through recent commits, reviewing dependencies, and running local tests. Code reviews get scheduled. Rollback plans get discussed. Hours pass.
Then someone checks the Kubernetes cluster directly — and discovers the pods are running perfectly fine, serving traffic, doing exactly what they were designed to do.
The code was never broken. The deployment actually succeeded. But the platform said otherwise, and everyone believed it.
This disconnect between what platforms report and what Kubernetes actually does causes confusion, wasted debugging effort, and unnecessary escalations. Understanding why this happens — and how to verify what actually happened — is essential for anyone working with Kubernetes-based deployment systems.
The Gap Between Platform Perception and Cluster Reality
Kubernetes-based platforms must make decisions about deployment success or failure. They set timeouts, check conditions, and render verdicts. The challenge is that Kubernetes operates on a different timeline — one built around eventual consistency and self-healing.
A typical deployment passes through several distinct stages:
- Image build is where source code becomes a container image. Many serverless and MLOps platforms use Kaniko to build images inside the cluster. Kaniko runs as a Kubernetes job, compiles dependencies, packages assets, and pushes the final image to a registry.
- Pod scheduling is where Kubernetes finds a suitable node. The scheduler evaluates resource requests, node affinity rules, taints, tolerations, and dozens of other constraints to place the pod appropriately.
- Runtime startup is where the container actually begins executing. The application initializes, loads configurations, and prepares to serve requests.
- Health probes verify the application responds correctly. Liveness probes confirm the process is running; readiness probes confirm it can handle traffic.
Here’s the insight: a platform might report “build failed” even when Kaniko successfully pushed the image. The platform’s status check timed out or encountered a transient error, but the build job completed in the background. The image exists. The pod might already be running it.
The Timing Problem, Visualized
A platform might check build status at the 60-second mark, encounter a timeout or transient error, and report FAILED. Meanwhile, Kaniko continues working. The build completes at the 90-second mark and pushes the image to the registry. Production deploys successfully at the 100-second mark. The application starts serving traffic at the 110-second mark.
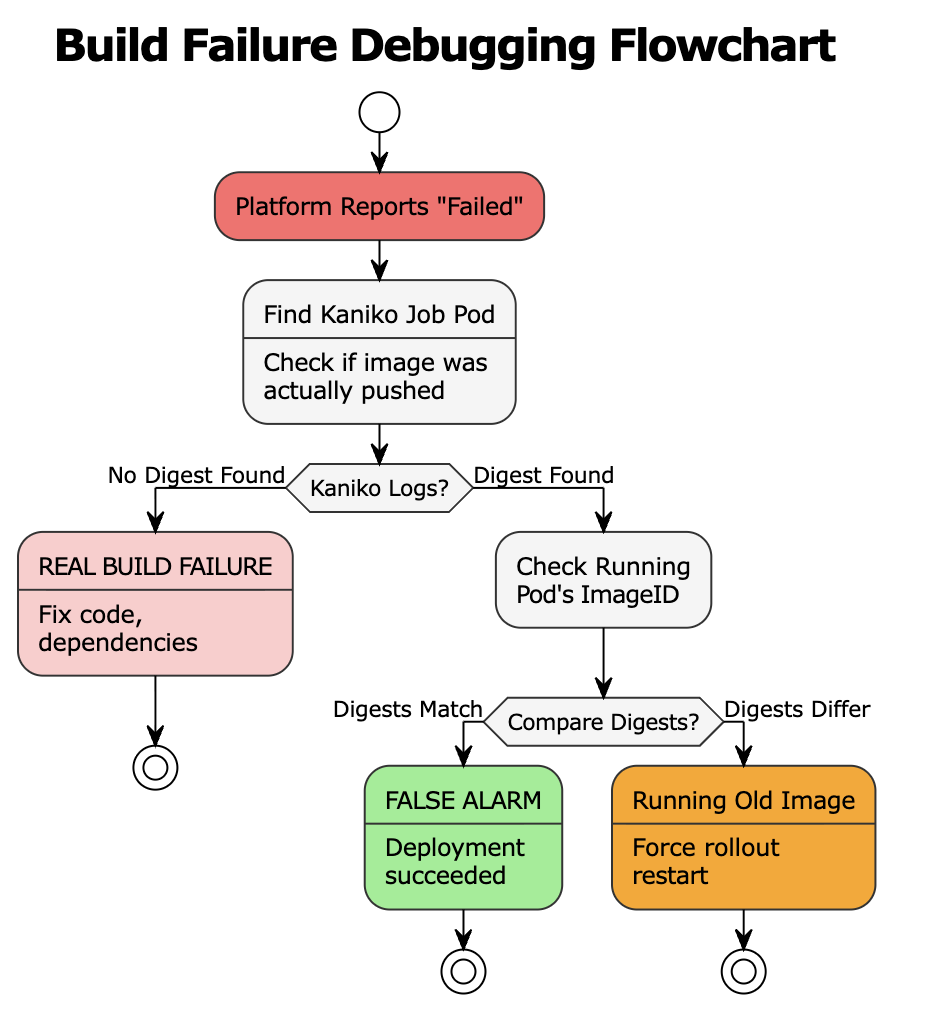
Quick Diagnostic Flowchart
When a platform reports a build failure, the first question isn’t “what’s wrong with the code?” — it’s “did the build actually fail?” Use this decision tree to quickly determine whether you’re dealing with a real failure or a false alarm.
Step-by-Step Verification
Step 1: Find the Kaniko Build Pod
Kaniko runs as a Kubernetes job. Find it:
kubectl get pods -n | grep -E "(kaniko|build)" Or look for completed or failed jobs:
kubectl get jobs -n --sort-by='.metadata.creationTimestamp' | tail -10 Step 2: Inspect Kaniko Logs for the Digest
What success looks like:
INFO[0045] Pushing image to registry.example.com/myapp/function:latest
INFO[0052] Pushed image to 1 destinations
INFO[0052] Pushed registry.example.com/myapp/function@sha256:a1b2c3d4e5f6789...
This digest is the source of truth for what was actually built.
If you see the Pushed line with a digest, the build succeeded regardless of what the platform UI says.
What failure looks like:
INFO[0045] Pushing image to registry.example.com/myapp/function:latest
INFO[0052] Pushed image to 1 destinations
INFO[0052] Pushed registry.example.com/myapp/function@sha256:a1b2c3d4e5f6789...
No digest = real build failure. Debug the code.
Step 3: Find Your Running Pods
kubectl get pods -n | grep |
Status |
Meaning |
|---|---|
|
|
Pod executing normally |
|
|
Waiting for resources |
|
|
Container crashing |
|
|
Can’t pull image |
Step 4: Get the Image ID from the Running Pod
kubectl get pod  -n  \
  -o jsonpath="{.status.containerStatuses[0].imageID}"
Output:
docker-pullable://registry.example.com/myapp/function@sha256:a1b2c3d4e5f6789...Step 5: Compare Digests
|
Result |
Meaning |
Action |
|---|---|---|
|
Digests match |
Deployment succeeded |
Close the alert—it’s a false alarm |
|
Digests differ |
Pod running older image |
|
|
No running pod |
Scheduling issue |
Check Events (see below) |
Reading Kubernetes Events
If the pod isn’t running, check why:
Scroll to Events at the bottom.
Self-resolved scheduling issue:
Warning  FailedScheduling  10m (x15)  default-scheduler  0/5 nodes: Insufficient memory
Normal   Scheduled         2m         default-scheduler  Successfully assigned to node-xyz
Normal   Started           1m         kubelet            Started container
The pod is running now — the platform just checked too early.
Decoding Common Scheduling Errors
Several error patterns appear repeatedly in production environments. Recognizing them accelerates debugging significantly.
“Insufficient memory” or “Insufficient cpu” indicates the pod’s resource requests exceed available cluster capacity. Every node might be running near its limits, leaving no room for the new pod. Cluster autoscalers typically respond by provisioning additional nodes, but this takes time — sometimes several minutes. The pod eventually schedules, but platforms with shorter timeouts may have already reported failure.
“Node affinity mismatch” means the pod specifies constraints about which nodes it can run on, and no matching nodes are available. This might involve requirements for specific availability zones, instance types, or custom labels. The solution involves either relaxing affinity rules or ensuring appropriate nodes exist.
“Untolerated taints” indicates nodes exist with sufficient resources, but they carry taints that the pod doesn’t tolerate. Taints are markers that repel pods unless explicitly tolerated. GPU nodes, spot instances, and system nodes commonly carry taints. Pods must declare matching tolerations to schedule on these nodes.
“FailedCreatePodSandBox” signals network-level problems. The container runtime couldn’t establish the pod’s network namespace. This typically involves CNI plugin issues, IP address exhaustion, or network policy conflicts. These problems require platform team involvement—they’re not application-level concerns.
“ImagePullBackOff” means Kubernetes cannot retrieve the container image. Causes include incorrect image names, missing registry credentials, deleted images, or network connectivity problems to the registry.
A reliable heuristic: errors appearing in Kubernetes Events almost never indicate code problems. They indicate infrastructure, configuration, or resource issues.
Verifying Image Deployment with Digests
Sometimes confirmation is needed that running containers match recently built images. This verification matters particularly in environments with image caching, multiple pipelines, or complex promotion workflows.
Container images have two identifiers: tags and digests.
Tags like latest or v1.2.3 are mutable — they can point to different images over time. Digests are immutable SHA-256 hashes that uniquely identify exact image contents. Build systems like Kaniko log the digest of every image they produce. This digest appears in build logs after successful completion.
To check what’s actually running in a pod:
bash kubectl get pod pod-name -o jsonpath="{.status.containerStatuses[0].imageID}"Comparing these digests provides definitive answers. Matching digests confirm the deployment succeeded — the running code is exactly what was built. Mismatched digests indicate the pod is running an older or cached image, explaining why recent changes don’t appear to take effect.
Decision Framework for Fast Resolution
|
Symptom |
Location |
Problem Type |
Action |
|---|---|---|---|
|
No digest in Kaniko logs |
Build logs |
Code problem |
Fix code, dependencies, Dockerfile |
|
Digest exists + pod running + UI says failed |
Kaniko logs vs kubectl |
False alarm |
Verify digest match, close alert |
|
Digest exists + pod not running |
K8s Events |
Scheduling problem |
Check Events, wait or adjust resources |
|
Digest mismatch between Kaniko and pod |
Kaniko vs running pod |
Stale deployment |
|
|
|
K8s Events |
Network problem |
Escalate to platform team |
Quick Reference Commands
# Force redeploy
kubectl rollout restart deployment/
# Find Kaniko build pod
kubectl get pods -n  | grep kaniko

# Get build digest from Kaniko logs
kubectl logs  -n  | grep "Pushed"

# Find function pods
kubectl get pods -n  | grep

# Get running image digest
kubectl get pod  -n  \
  -o jsonpath="{.status.containerStatuses[0].imageID}"

# Get pod events
kubectl describe pod  -n

# Force redeploy
kubectl rollout restart deployment/ -n
Conclusion
Most deployment failures reported by platforms aren’t failures in any meaningful sense. They’re snapshots of a system in transition, captured before Kubernetes completes its self-healing work. Learning to read Kubernetes events transforms mysterious red dashboards into explainable, predictable behavior. It eliminates wasted debugging sessions, reduces unnecessary escalations, and builds confidence in deployment systems.
The next time a platform reports failure, check the cluster directly. The pods might already be running fine — waiting for someone to notice.
